
Introducing Multi-Dimensional Reporting
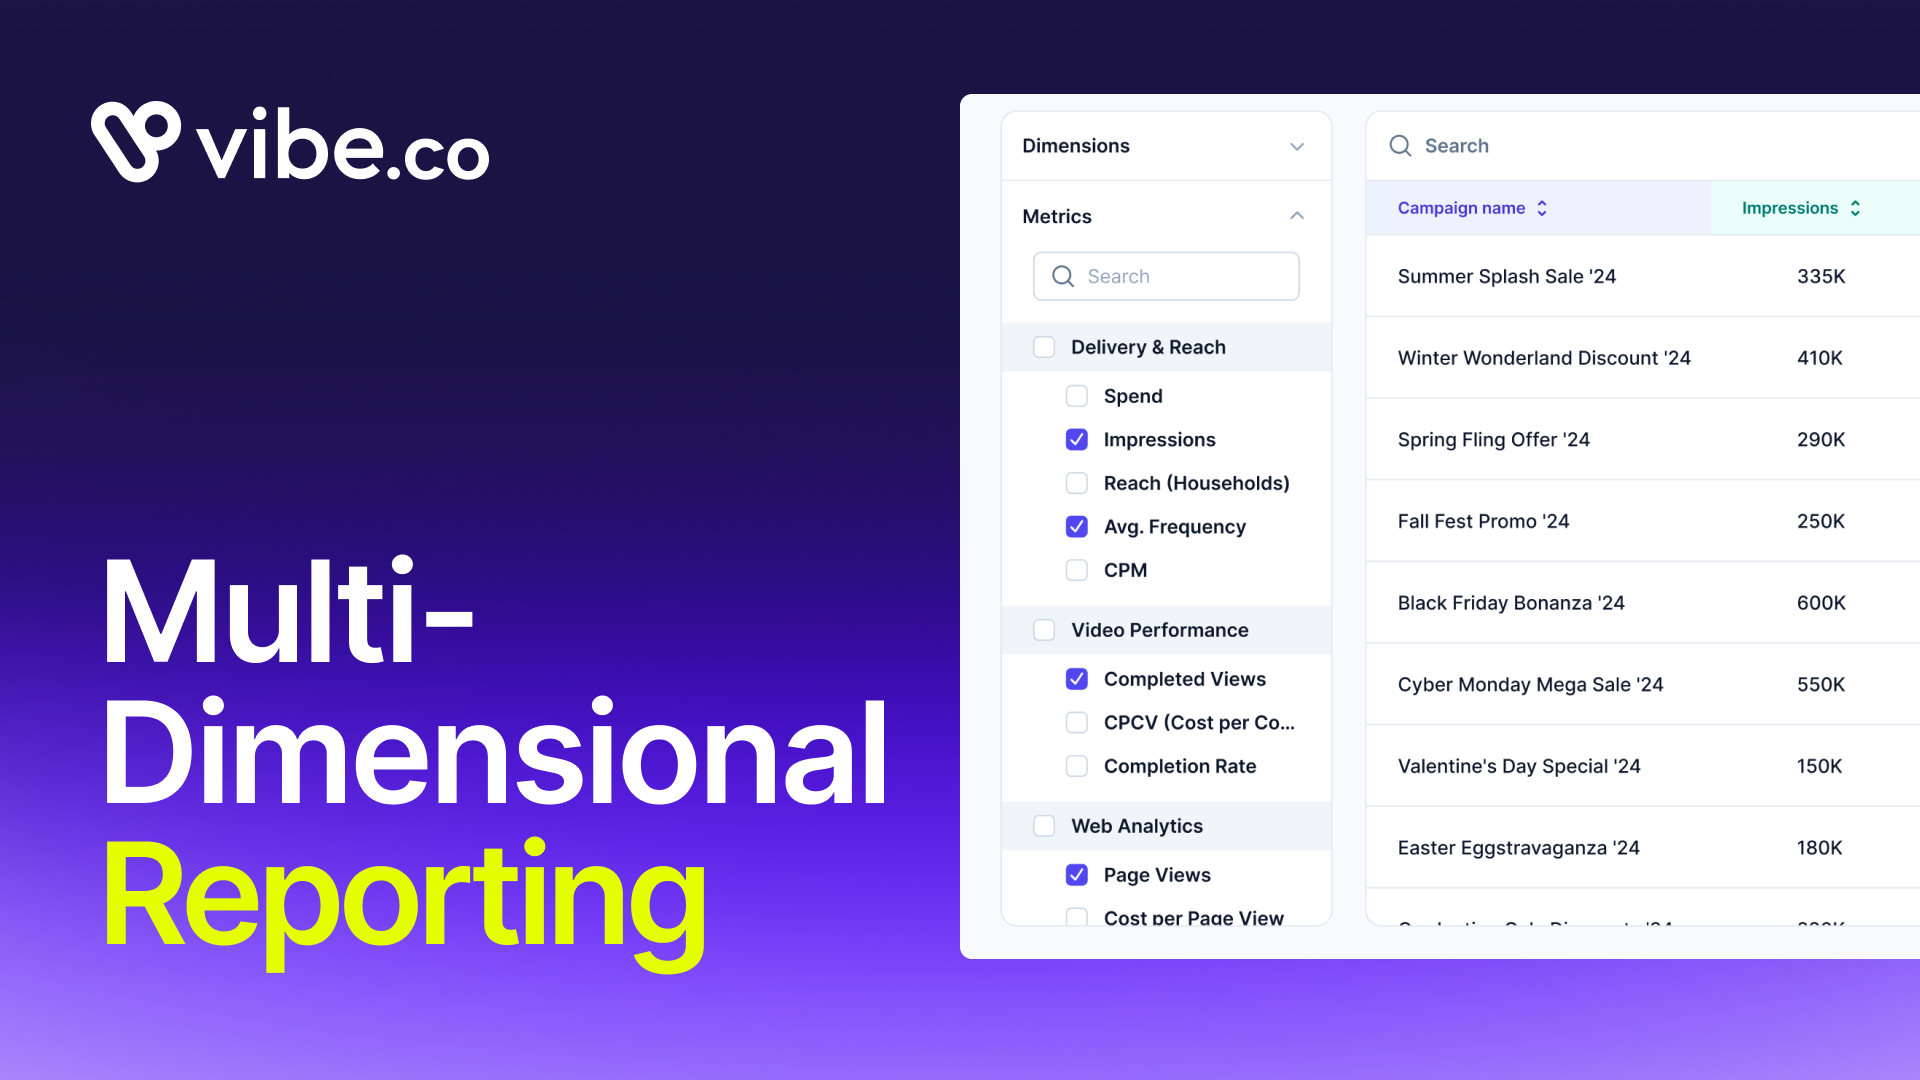
Vibe now has a native pivot table for CTV. You can slice your campaign data across two dimensions at once, inside the platform, with live numbers and no spreadsheet required.
Pick Date x Campaign to track pacing across every campaign in a single table. Pick Channel x Creative to see which creative is working on which channel, right now. Collapse the rows you don't need. Share a link or schedule a report to be sent. The table stays current because it's connected to your live campaign data, not a snapshot you exported this morning.
The problem with CTV reporting
CTV campaigns generate a lot of dimensions worth analyzing: campaigns, channels, creatives, dates, audience segments, placements. The question "which creative is driving performance on which channel this week?" is simple to ask and genuinely hard to answer without a pivot table.
Until now, answering it required leaving Vibe. Export a CSV, build the pivot in a spreadsheet, format it manually, and send a static file to whoever asked. By the time they opened it, the data was already stale. Next week, the same question required the same rebuild.
The gap wasn't analytical sophistication. It was tooling. Pivot tables are a solved problem everywhere except inside the ad platforms where the underlying data lives.
Multi-Dimensional Reporting closes that gap for CTV.
How it works
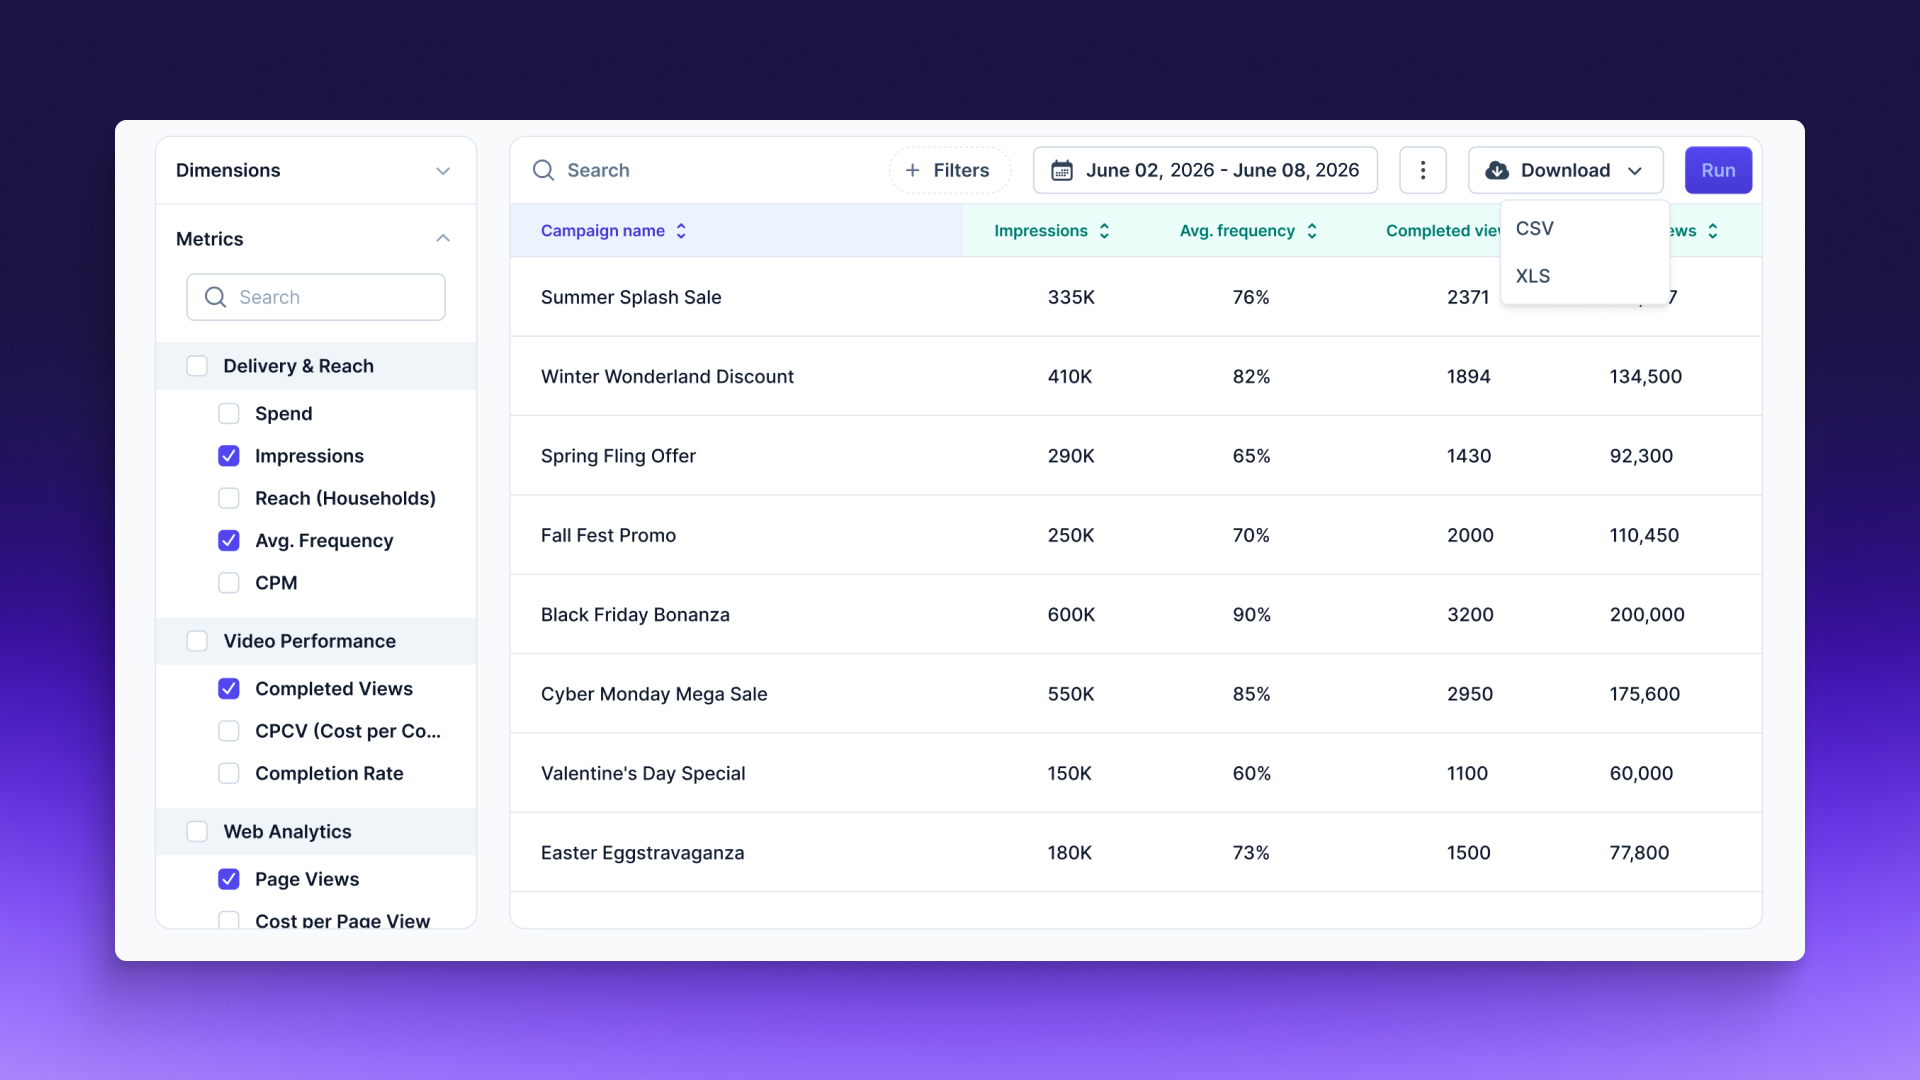
Multi-Dimensional Reporting works like a pivot table, built natively into Vibe. You define two axes, choose your metrics from the left panel, and get a collapsible live table. Every cell reflects your current campaign data.
Date x Campaign rows out your campaigns against a date range. Each row is a date or date interval. Each column is a campaign. The intersecting cell shows the metric you've selected: spend, impressions, ROAS, completed views, CPM, or any other delivery or performance metric in your account. If a campaign is paused or irrelevant to the period you're analyzing, fold the row. The table becomes exactly as wide as the question requires.
Channel x Creative maps creative performance across channels. You see, in one table, which creatives are delivering and where. No aggregation, no separate export per channel, no manual join. The breakdown is already there.
Metrics are selectable independently of dimensions. You're not locked into a preset view. Check Completed Views alongside Impressions, add Cost per View, remove what isn't relevant. Run the table. The configuration is yours.
For advertisers running multiple campaigns
The more campaigns you're running simultaneously, the harder it is to hold cross-campaign performance in your head. You're constantly switching between views, exporting separate reports, trying to reconcile numbers that came from different moments in time.
Multi-Dimensional Reporting solves that by making cross-campaign comparison a single step inside the platform. Date x Campaign gives you every campaign's pacing in one table. You can see at a glance which campaigns are delivering against budget and which need attention, without switching contexts or rebuilding anything. For advertisers who review performance weekly with a client or internal stakeholder, the workflow change is significant.
For agencies
If you manage campaigns across multiple clients, the manual reporting deck is the single most time-consuming deliverable that adds no analytical value. Building the same pivot table in Excel or Google Sheets every week is a workflow tax, not a skill.
Multi-Dimensional Reporting removes that tax. Your client report is no longer a spreadsheet someone has to export, format, and send. It's a live view you can open on a call, filter in real time, and share as a link.
The Channel x Creative breakdown is especially useful when a client asks why performance shifted. You don't have to rebuild the table to answer. The table is already there, with live data, broken down the way the question was asked.
What it doesn't replace
Multi-Dimensional Reporting is built for in-platform analysis and reporting. If your workflow routes raw data to a downstream pipeline or warehouse, CSV export remains available. For most reporting conversations, the live table is faster.
Additional dimension combinations and custom metric configurations are on the roadmap. If there's a CTV-specific breakdown that would change how you analyze campaigns, the feedback option in your dashboard is the fastest path to getting it built.

Clay Ads + Vibe.co: Run CTV ads against your Clay audiences
Clay Ads + Vibe.co: Run CTV ads against your Clay audiences
Run CTV ads against your Clay audiences
Introducing the Freshpaint x Vibe.co Integration: HIPAA-Compliant CTV for Healthcare Marketers
HIPAA-Compliant CTV for Healthcare Marketers
Introducing Keanu 3.5 + Carrie-Anne 1.0
New performance model uodate
Introducing Vibe Agent
AI Agent lets advertisers ask their campaign data plain questions.
Introducing Vibe for Developers: Build CTV Advertising into Any App
Vibe's Developer Platform lets platforms build CTV advertising into their product via API: campaign creation, audience sync, attribution, and reporting.

Get started with Vibe
in minutes.
Industries
© 2026 Vibe, Inc.